New Zealand Hospice Benchmarking Pilot 2010 - 2011
New Zealand Hospice Benchmarking Pilot 2010 - 2011
Background
In 2008 hospices across New Zealand identified benchmarking as a critical area in terms of the future development of services. Hospice NZ investigated the many options available to provide an evaluation and benchmarking process for hospices. QPS Benchmarking (QPS) was identified as an experienced company to partner with in this area.
QPS, Hospice NZ and its members then researched and designed a range of key performance indicators to demonstrate the quality, care and support provided to those with a life limiting illness and their families. From April 2010, 25 hospices began a nine month pilot to validate the performance indicators chosen and to validate data collection tools.
Each quarter, participating hospices collected information and submitted the data online via the QPS website. QPS cleansed and collated the data and presented it to the hospices in a report, allowing each hospice to compare its performance to others in the benchmarking programme as well demonstrating each services trend results over time. Members can also access their results in real time through an e benchmarking feature.
Pilot Learning's - Summary
Following the pilot, participating hospices and Hospice NZ had the opportunity to review the process, indicators and results of the programme with QPS. The hospices provided invaluable feedback and a willingness to share their ideas with each other to improve services for patients and families. A list of future KPI's was also identified to include other important areas of performance such as clinical and safety measures. It is proposed to workshop these face to face with maximum participation from each Hospice to ensure the Key Performance Indicators meets the needs and information requirements of the benchmarking participants.
The QPS Benchmarking Framework
The Key Performance Indicator model was in part designed to minimise the duplication of data collection and reporting required by Hospices. Aligning the KPI's to the HISO National Specialist Palliative Care Data Definitions (currently in draft), continues to be a priority. The QPS Benchmarking KPI model has been reviewed and member feedback on each KPI was recorded for action during a teleconference in February 2011. The Benchmarking participants have reported, the QPS data submission on line features are easy to use and the data cleansing processes in place ensures data errors are removed prior to producing the reports.
Satisfaction Measures
The introduction of a national satisfaction measure, developed by QPS Benchmarking, HNZ and its members, for the first time will enable hospices to benchmark the quality of care they provide against each other as well as ensure they are appropriately meeting patient and family needs. Research undertaken by University of Auckland at three Auckland hospices showed these tools were acceptable and usable to patients and staff. The recommendations made in the research findings were made to the survey tools and redistributed and uploaded to the QPS Benchmarking Resource Library available to all benchmarking participants.
An important issue regarding the "process" for distributing the surveys to both inpatient and community care clients and family members has been identified. While the Hospices' recognise the importance of this strategic indicator and the value of obtaining feedback from its key stakeholder groups using valid tools, difficulties have been experienced in identifying the most efficient way to distribute surveys. Requests for assistance have been received and there is a process underway for QPS to "map the process" where the distribution method in place is working very well in one of the Hospices. Once this "deployment flow chart" has been completed, it will be shared with the QPS benchmarking participants.
Participants also have a choice of undertaking surveys annually as a snapshot measure which is able to be benchmarked while continuing to undertake their own personalised surveys.
Sharing Knowledge
In a willingness to share strategies for improvement, the participants opted to identify themselves in a Management report made available by QPS. This report allows participants to identify the best performers and share information to make improvements.
Some of the benefits reported from hospices
"This project has had a very long gestation period and is a positive step to greater transparency and sharing of information between hospice services, which will assist us all in achieving best practice across all aspects of our services"
"The value of the QPS Benchmarking Project is really beginning to shine through. We can now look at our organisation more critically across a range of core functions. We are able to analyse and compare service delivery, patient satisfaction, human resource, financial and fundraising performance. We can more accurately identify strengths and weaknesses. We can also see what best practice looks like. These tools are already assisting us with longer term planning".
"(Our) Hospice has been able to compare its performance with other hospices and see areas for improvement. Benchmarking can be used as a carrot or a stick, I see it being used as a carrot for hospices. It opens doors to opportunities for improvement."
The Way Forward
24 out of 28 hospices have currently signed onto the programme going forward in 2011.
Step 1- KPI Manual Update
The KPI manual will be updated to Version 3 incorporating member feedback and alignment to the HISO National Specialist Palliative Care Core Business Process and Data Definitions Specifications. These changes are likely to be incorporated from the October quarter 2011 (dependent on the confirmation on Interim Standard status of the above standards).
Step 2 - New KPI's
To schedule a face to face workshop with Hospice New Zealand, Silvia Holcroft, QPS Director and the benchmarking participants to review the "suggested list of KPI's" captured by QPS during the teleconference and feedback received from individual Hospices directly to QPS over the pilot period.
Future Initiatives - Target Setting
QPS continues to improve features to its online benchmarking services to ensure leading edge practices are provided to its clients. The ability for members to set their own targets for each KPI is one example of new features being planned for in the near future.
Individual Benefits
The benchmarking data can be used to inform decision making at the individual hospice, regional and national levels. They can be used to guide strategic goals, identify practice improvement objectives and future planning.
National Benefits
This evolving QPS collective data set will provide rich information on the needs of the hospice sector and will guide national priorities. QPS and HNZ are currently investigating the analysis of data from a national perspective and will include reference to other work currently being undertaken in the palliative care sector (e.g. Palliative Care Council Needs Assessment Project). Hospice NZ will also ensure its annual data collection will align to the QPS data available to reduce workload for member hospices where possible.
Examples of Aggregated National Results
The following examples show a national snapshot of hospice services related to some key indicators from the QPS Palliative Care Benchmarking programme. They are based on self reported data submitted to QPS by participating hospices each quarter. The displayed data is the weighted mean figure for each KPI across the first 12 months of benchmarking (April 2010- April 2011).
Referrals - The intent of the referral indicators is to measure all new/ actual patient referral sources by category as a percentage of total referrals received during the quarter.
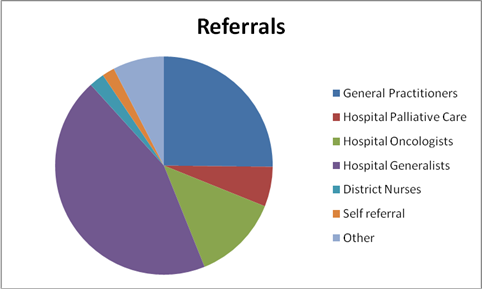
Data sample size:
All 25 hospices submitted data for the first 3 quarters with the exception of quarter 4, where 24 hospices submitted data.
Analysis:
The referrals from Hospital Generalists are the largest referral source and the aggregated trend report demonstrates this has increased slightly during the last 12 month period.
The next largest referral sources are the General Practitioners. It's interesting to note that while changes are demonstrated in the referral patterns over the last 12 month period, for example, decreases in referrals from Hospital Oncologist and District Nurses and increases in referrals from Hospital Generalist and Self Referrals, the percentage of patients admitted across all benchmarking participants, with a malignant diagnosis has remained relatively stable over the 12 month period. (Refer to Trend Graph A below)
Trend Graph A - Malignant Diagnosis
1. Diagnosis
The intent of the Diagnosis indicators is to measure the new patients admitted to the service with a malignant or non malignant primary diagnosis as a percentage of all new patients admitted.
Analysis:
The percentage of non malignant diagnosis has decreased in the last 12 month period, in particular Neurological and Respiratory non malignant diagnosis has decreased. The percentage of Renal and Cardiovascular has remained the same, while Multiple non malignant diagnoses have increased.
2. Ethnicity
The intent of the Ethnicity indicators is to measure the ethnic origin (as identified by the patient), by category of patients admitted as a percentage of all patients admitted.

Analysis:
The largest ethnic group of patients admitted to the Hospices within the benchmarking group is NZ European. There has been a decrease in the number of patients admitted in this category as well as decrease in Pacific Peoples and Asians. The number of patients admitted of Maori origin remains the same. The number of "other" category has increased which demonstrates that some patients are not able to be clearly identified by ethnic origin. It is anticipated that the revision of the HISO National Specialist Palliative Care Data Definitions will assist in addressing this issue.
3. Place of Death
The intent of the death indicators is to measure the place of death by category as a percentage of total deaths.
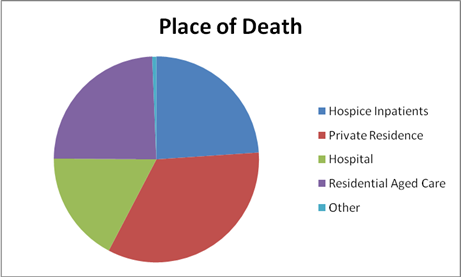
Analysis:
The most common place of death is the private residence, and while this result remains stable over time, did peak / increase during the October- December quarter.
4. Volunteer Hours
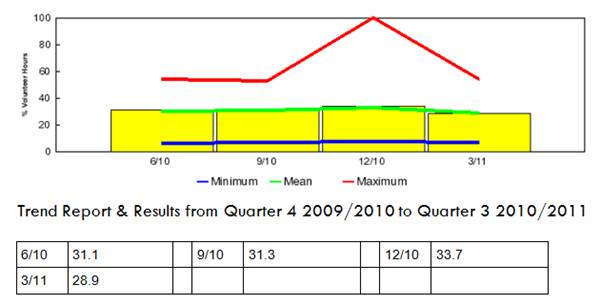
Volunteer hours accounts for approximately 30% of total hours across all hospices. This result has remained relatively stable over the 12 month period with the exception of the Christmas period when it increases, with one service utilising 100% of volunteer hours to run the service. It has been identified that Hospices utilising higher levels of volunteer hours need to ensure they have a succession plan in place to replace these volunteers in the future.
0 comments