Resident and Relative Satisfaction 2008
Resident and Relative Satisfaction 2008 - A Year in Review
QPS clients have been using the same resident and relative satisfaction surveys for the past two years. This enables us to trend and compare results for the past two reporting periods for this important indicator. Observations on these results are listed below the charts.
Resident Satisfaction
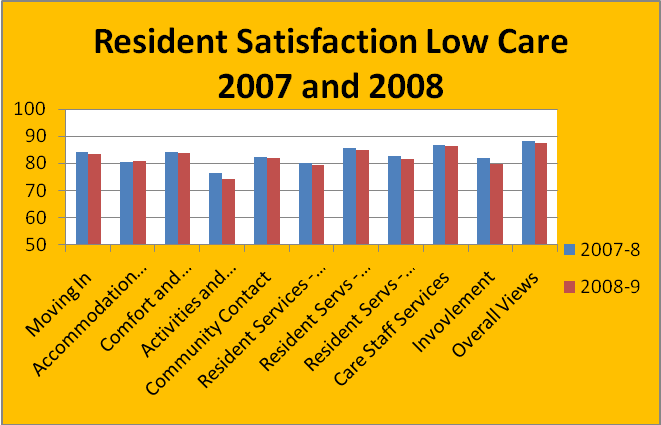
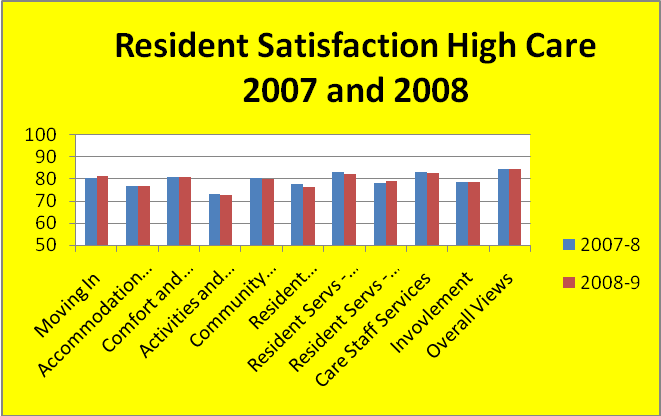
Note: The results shown in the graph are the percentage scores achieved in the QPS survey. The maximum score = 100, the minimum score = 0.
Overall satisfaction levels have remained reasonably constant despite the significant challenges faced by the industry during 2008 e.g new funding mechanism (ACFI), increasing pressure on financial outcomes, nursing staff shortages.Reported satisfaction levels are higher in low care than for high care, although the gap between the two levels of care is reducing. QPS measures of resident acuity indicate that the needs of residents in low care continue to increase and the gap between needs of residents in high and low care continues to decrease.
The areas of care and service that generate the highest levels of satisfaction are: resident services - environmental e.g. cleaning laundry; and, care staff services. This is common for both high and low care.
The areas of care and service that generate the lowest levels of satisfaction in high care are: activities and passing the time; accommodation and living areas; and, food.
The areas of care and service that generate the lowest levels of satisfaction in low care are: activities and passing the time; food; involvement and accommodation and living areas.
Relative Satisfaction
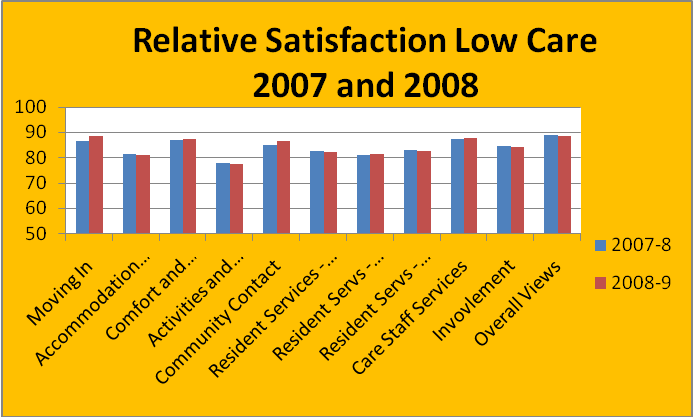
Note: The results shown in the graph are the percentage scores achieved in the QPS survey. The maximum score = 100, Minimum = 0
Relative satisfaction levels in low care generally remained the same with some improvement noted in the areas of Moving In, Comfort and Surroundings and Community Contact. This contrasts with high care where overall relative satisfaction levels showed a small decrease. There were small decreases in relative satisfaction recorded in some sections of the survey including: Comfort and Surroundings; Community Contact; Care Staff and Involvement.
There was strong consistency in the views of both residents and relatives across the section headings i.e. similar scoring patterns were recorded across the section headings. Residents and relatives generally agreed on the areas of highest and lowest satisfaction. The strongest levels of satisfaction were recorded for Moving In, Comfort and Surroundings (Low Care) and Care Staff Services.
Relatives tended to rate food higher than the residents. Residents rated food services at 76% (High Care) and 79% (Low Care) whilst relatives rates food at 80% (High Care) and 82% (Low Care).
Comment
QPS knows that many of its clients have worked very hard on the area of activities and passing the time, and some have enjoyed spectacular success. The results indicate however that there is still much work to do and ideas to share and implement. Many of the client contributions to the newsletter contain ideas on this important area of service. Note that clients can access previous newsletters on the QPS web site to review what strategies have worked exceptionally well for residential aged care services.
The results show that satisfaction levels in low care exceed those of high care. This tends to indicate that meeting client expectations becomes more difficult as the level of care increases. It is noted that the QPS indicators that measure resident needs (the previous average RCS Score, Average dollars per resident and ACFI Domain indicators) all show trends towards higher levels of care in the low care facilities. This, in part, might explain why resident satisfaction levels have dropped slightly across the data base in low care.
0 comments