The Relationship between ACFI Funding and Care Staff Work Hours - 2011
The Relationship between ACFI Funding and Care Staff Work Hours - 2011
For the past two years, QPS has published the following graph showing the relationship between ACFI funding and actual care staff work hours for all facilities submitting data for both of these key performance indicators. Now that the ACFI increases for the 2011-12 financial year have been reported into the QPS data base, we have reproduced this graph to update the results and demonstrate the funding increases.
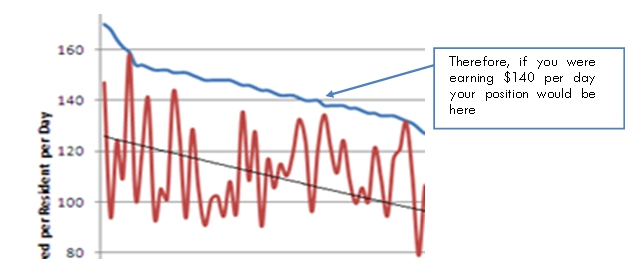
To read the graph and understand your own facilities' position, follow these steps.
Work out your average income level from ACFI / RCS (according to the QPS definition and calculation method) and plot your position on the blue line. QPS KPI 1.1.2.
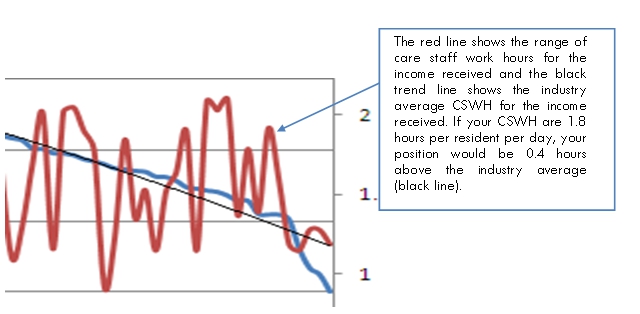
Work out your average care staff work hours (CSWH), according to the QPS definition and calculation method, QPS KPI 1.1.2. and find your position using the scale on the right hand side of the graph.
The full QPS Benchmarking Funding Vs Care Staff Hours Relationship for the September Quarter 2011 quarter is shown in the following graph.
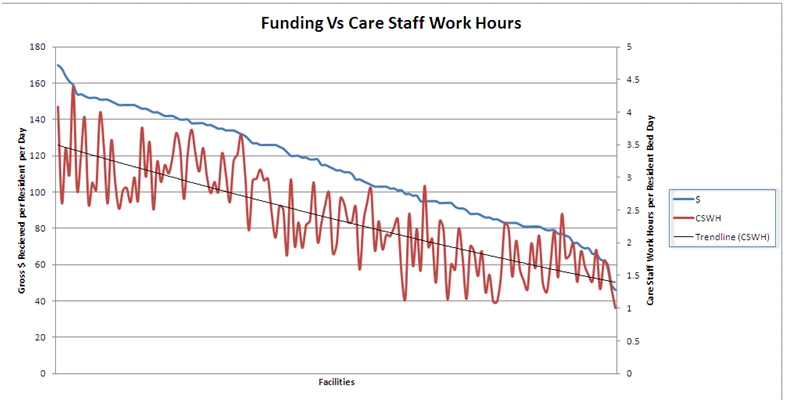
When viewing the above graph the following points need to be considered.
Additional facilities have collected and reported care staffs work hour data this year compared to the previous year indicating both an increase in QPS membership and increasing interest of QPS Benchmarking clients in the direct relationship between income and the major expenditure heading of care staff.
Note; the following data has been excluded; public facilities with set enterprise bargaining agreements; facilities that have dual aged care / acute sector roles that push up care staff work hours; and those facilities that are undergoing significant change e.g. commissioning of new units or winding down.
Observations
The most noticeable feature has been the overall increase in the average ACFI subsidy level. As per the exclusions mentioned above, there are a selected 105 facilities that completed both sets of data last year and this year. The average income level for this group of clients increased from $105.88 to $114.70 an increase of $8.82 or 8.33%. For the same group, the number of hours per resident bed day increased from 2.33 to 2.40, an increase of 0.07 hours or 3.00%.
Compared to the previous year there have been some significant increases in average ACFI funding at the top end of the graph (far left) with the abolition of the ACFI funding cap. It is also interesting to note that some facilities at the top end of ACFI income are employing a higher care staff work hour ratio with several facilities increasing the ratio to well over 3.5 hours per resident bed day. This should be contributing to better outcomes in facilities with the highest levels of care.
0 comments